Business decision making means selecting alternatives and inventing things to make your business more successful. As you can imagine, it is not easy to do at all. How do you evaluate if it is worth tapping in the Nigerian market for your company? How do you know if it is time to retire the historical product that your brand has been selling for years? How do you know if it is time to change the identity of your brand and adopt something that resonates better with Gen-Z?
There is no magic pill for those decisions. But there is a framework that can help you approach those decisions in the right way and make the most out of what you know. This is the ultimate guide to business decision-making; you can read only this and look no further. Unlike most blah-blah like articles you will find online, this guide is no-nonsense. We will see actionable steps to approach decisions, including some math around it.
Of course, we apply everything to business decision-making, but you could apply the same concepts to your personal decisions if you really want to get the most out of them. As usual, huge amount of content to cover: this is the ultimate guide after all, isn’t it? Look at the table of content for the details.
Introduction to Business Decision-Making
What is Business Decision-Making?
Okay, you may understand intuitively that business decision-making is something like “making decisions about a business”, or it is the set of decisions you make when you own or run a business. You are correct, but let’s have a formal definition of that.
Business decision-making is the process of making decisions that alter the course of a business.
Here, the key is “alter the course of a business”. In fact, any company has many different decisions that people need to make at many different stages and levels. Decisions can be as simple as “the soap container in the toilet is roughly 20% full, shall I refill it now or wait for the next time I pass by?”. This is a small decision, and it is not likely to impact where the business will go.

Of course, many small decisions compound to big outcomes, but making an analysis for each small decision is often unfeasible: doing analysis is costly. So, we can say that business decision-making is the process of making any decisions that warrant at least some sort of analysis.
In practice, this may translate into things like opening a new office, outsourcing production of some components to an offshore manufacturer, whether to buy a Superbowl ad or not, what services to offer, and so on. If it can have an impact on your business, then it is part of the decision-making process.
In this guide to business decision-making, we will focus on a framework to make decisions, rather than approaching individual decisions. The framework you see here can apply to decisions in sales, production, marketing, research, product development, and literally any field of business. We will give some examples, but remember that the framework applies regardless of the context.
Before we do that, however, it is worth classifying business decisions at two levels: strategy and tactic.
Business Strategy
There are many conflicting views of what strategy is, and everyone seems to have his own personal view. For the sake of business decision-making, we can use a simple definition.
Business strategy is choosing the arena where you compete.
It is choosing one thing over another, things that are mutually exclusive. For example, if you decide to pursue highly efficient and standardize inexpensive meals (fast food), you can’t choose to be an expensive and custom-tailored restaurant at the same time. You must pick which side you are on. You need to choose if you want to compete with other fast food restaurants, or with other fancy diners. But you won’t be able to do both with the same restaurant or company.
This is not simply about “let’s enter the French market instead of the Spanish market”. Strategy is about let’s do A so that it makes us impossible for us to do B, but let’s trust that A is the right thing to do. If you want your brand to be energetic, young, and outgoing, it will not be able to be traditional and authoritative at the same time.
This is business strategy. Over time, if you make decisions that reinforce your strategy continuously, you will create some distance between you and your competitors. If you move in the right direction, you will be thriving. So, when making a business decision you always need to think:
- Does this decision align with my strategy, or move me away from it?
- Is this strategy (as set of decisions) really moving me in the direction I want to go?
Business decision-making around strategy is infrequent and careful. You don’t want to change your strategy every so often, you want to really think about it and then stick with it for a while. But this sets the framework for everything else: it defines how willing you are to take risks (or not), what markets you are into, and how your culture will unfold around decisions.
First think strategy, then define everything else. When deciding, consider if it is a strategic or tactical decision. It is going to be strategic if it puts you at a crossroad, and going one way implies you really can’t go the other way anymore. What about tactical decisions? Let’s read about those in the next section.
Business Tactics
Business tactics (and related decisions) are more mundane decisions you make day in and day out. Should I make this ad a little bit more controversial to spark some more reactions? Should I make discounts around Christmas season or not? Am I offering 1-week or 2-day shipping? Those are decisions that are easy to make, simple to reverse, and you need to perform a lot of those.
You want your tactical decisions to align with your business strategy. This is paramount. Still, even if they are small decisions, it does not mean they are not worth any analysis at all. All decisions are worth some analysis (we will see exactly how much later). This is important because many tactical decisions build up to create significant impact for your business.
The framework we will introduce around business decision-making applies both to business tactics and business strategy. It does not mean it is generic, it means you can implement it at different levels of depth depending on the type of decision you are facing.
The Role of Uncertainty
The problem of business decision making is that you don’t know. You don’t know if your new offshore manufacturer will screw up once you give your product to them. You don’t know if your controversial ad will backlash or if it will be a wild success. Simply put, you don’t know. You don’t see in the future.
Uncertainty plays a key role in decision-making. In fact, uncertainty is the reason why we need to decide in the first place. If there was a step-by-step rule with clearly defined outcomes, it would be a no-brainer. If you could know in advance with certainty that the manufacturer will screw up you won’t outsource, there will be no decision to make. If you knew in advance the controversial ads would be a wild success you would just do it, and there will be nothing to decide about it.
But the real world doesn’t work in this way. You don’t know. This is what our business decision-making framework is about. The framework will include a measure of uncertainty in your analysis, so that you can decide based on that as well.
To approach business decision-making, in fact, you need to think about measures differently. Instead of estimating, predicting, or assuming a single number, you need to use a range with a confidence interval. For example, instead of predicting “I think building the new factory will cost $10m” you can say “I am 90% confident that building the new factory will cost between $8m and $12m”.
Of course, you should not just come up with those numbers randomly: you should have some reasons behind them. This approach adds some complexity: if your expected additional revenue is $12m and the estimated factory costs are $10m, then you have $2m of profits. But if your costs are a range (say $8m to $12m) and your revenue is also a range (say $10m to $12m), you don’t know for a fact you will be profitable. The framework can address this case as well.
In general, when you are predicting the future there is uncertainty. Pretending there isn’t is not realistic and naïve. Any good framework to guide decisions must take that into account.
Quick Guide to Business Decision-Making
If you are in a rush and don’t have time to understand the full theory right now, this is the part of the guide you need to read. We will see everything you need to do to make good business decisions if you are in a hurry.
There are a series of steps involved in Business Decision-Making:
- Formulate a differential problem
- Create a model that works well with absolute values
- Estimate parameters using statistics
- Run a Monte Carlo simulation on your model
- Decide based on the simulation’s output, or reduce uncertainty further
First, we need to define a differential problem. That is, if you are making any decision, it means you have two (or more) choices. There is no point in formulating a problem if you don’t have any choice after all (for example, you attempted a project and it failed and now there is nothing to do about that). Formulating a differential problem also means considering the difference between choices.
Imagine you are a law firm and are considering buying a billboard ad. You can start to create a scenario where you buy the ad: it will have the cost of designing, printing and paying to display the ad, plus the additional revenue coming from new customers, plus the cost of dealing with people who call you and then don’t turn into customers. Another scenario is where you don’t buy the ad. Here you don’t have additional costs, nor you have additional revenue: this scenario has a value of 0 with a confidence of 100%.
What you don’t want to do is add items that are identical to both scenarios. For example, the cost of paying the rent for your office is not a differential: you pay it the scenario with the ad, and also in the scenario without the ad. So, you should not include it in your analysis at all. Only include things that are differential.
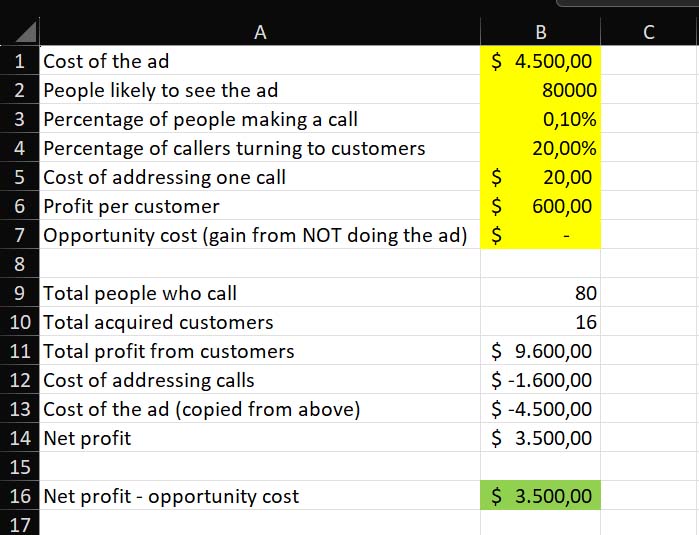
Once you thought about possible scenarios, you should create a model around them. This may sound fancy, it may even make you feel like a data scientist. Truth to be told, this simply means creating a simple (or complex) Excel sheet. Think about the problems you were solving in elementary school, like computing the area of a rectangle. You first put a list of parameters, like base and height of the rectangle, and then figured out the formula to compute the result (base * height).
A model for business decision-making is just a glorified version of that. You start by listing a set of inputs, and then you define some intermediate formulas to produce some additional values. Finally, with yet some other formulas, you reach the result. In this example, we can show the input cells in yellow and the output cell in green.
And these are the formulas we put in the various cells (we can see them thanks to the “Show Formulas” tool in Excel).
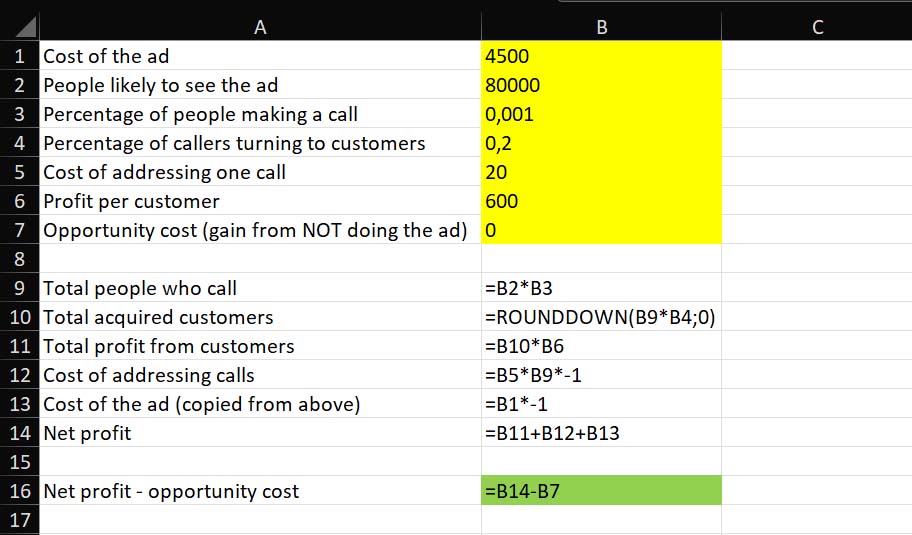
Since we put formulas referencing the input cells, whenever we update input cells the output will be updated to reflect the change in inputs.
The next, and probably the most crucial step, is estimating the input parameters. We can do that with statistics. For any input parameter, you need to think about two items: the likely value, and how much you think it can differ from that likely value in 90% of the cases. The goal here is not to have the narrowest range, but to have the more realistic range.
For example, if you are a lawyer, you can make a guess about how much it will cost to display the ad. However, if you are a seasoned marketer, you will have much more insight into this matter. The marketer will be able to produce a narrow range (say between $2400 and $2600 per month), while the lawyer will need a much wider range to achieve the same 90% level of confidence (say, $1000 to $5000). Once again, the goal is not to have the narrowest range. The goal is to have a range that you are truly 90% confident about.
Instead of providing a range, defined by lowest and highest value, you need to provide the center value and the distance it can get from it. For example, if you estimate a range between 8 and 12, then you need to provide the center (which is 10) and how far it can get from it (2, because 8 is 10-2 and 12 is 10+2).
You use these values in NORM.INV formula with RAND. This will use a standard distribution to generate a likely value within that range, different every time. Values that are closer to the center are more probable.
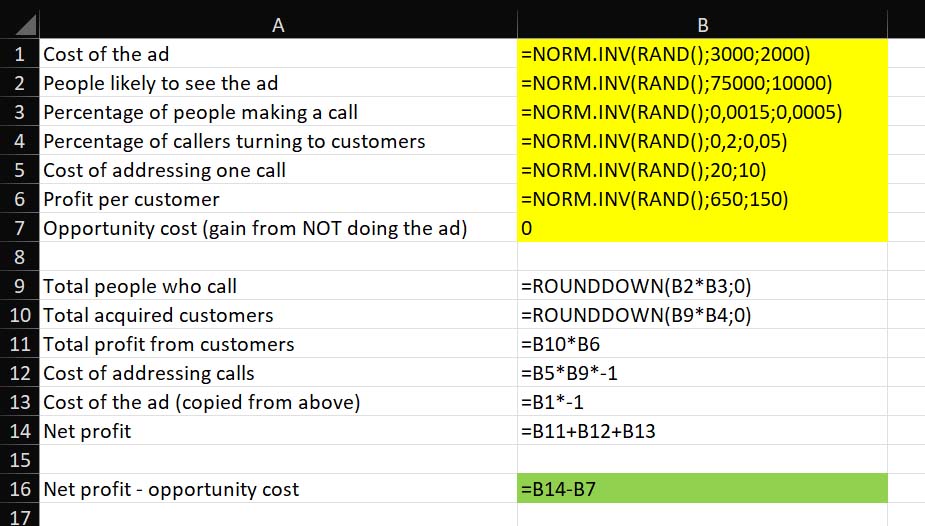
For example, for the ad cost we estimate a center value of 3000 with a standard deviation (how much it can differ) of 2000. Effectively, this is the range between $1000 and $5000. We put these two values in the following formula:
=NORM.INV(RAND();3000;2000)And we write this formula in cell B1, to define the cost of the ad. You will get a random value, and every time you refresh the sheet you will get a new value, always calculated thanks to probability in this distribution. You don’t need to know a lot about statistics, just know Excel will generate a likely value.
We can use this same formula by changing mean and standard deviation to fill all our input (except the opportunity cost, which we know to be 0 for a fact).
This will generate an output value that is different every time. Of course, each single individual output value is just a statistical guess, not much better than what we could do on our own. Power comes with big numbers. If we run this model many times and let it generate many different outputs, we will find out the most likely values.
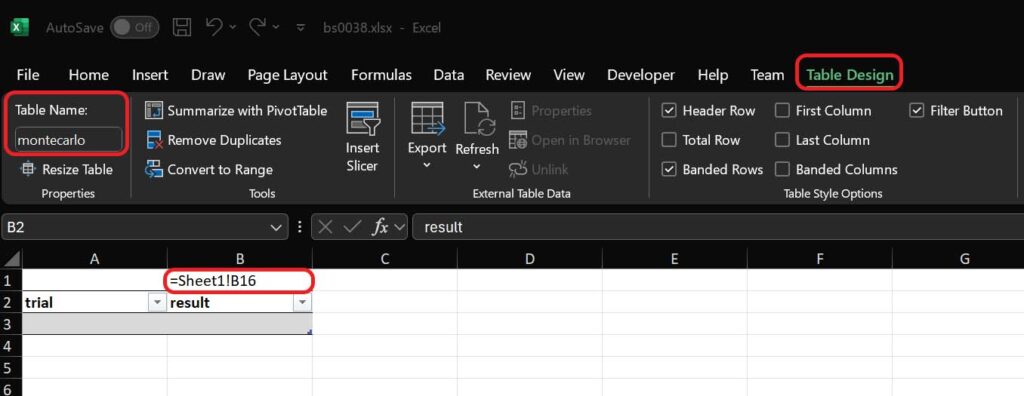
To do that, we need to create a new sheet with a table named montecarlo in it, that has only two columns: one to keep the number of trial (as we will run many trials in our model), and another to store the result. We will run our model 1000 times and store the results accordingly. Create this table starting from cell A2, and in cell B1 reference your green cell from your original sheet, the one that contains the output. Here is the result (with “Show formulas” to make things easier for you to copy).
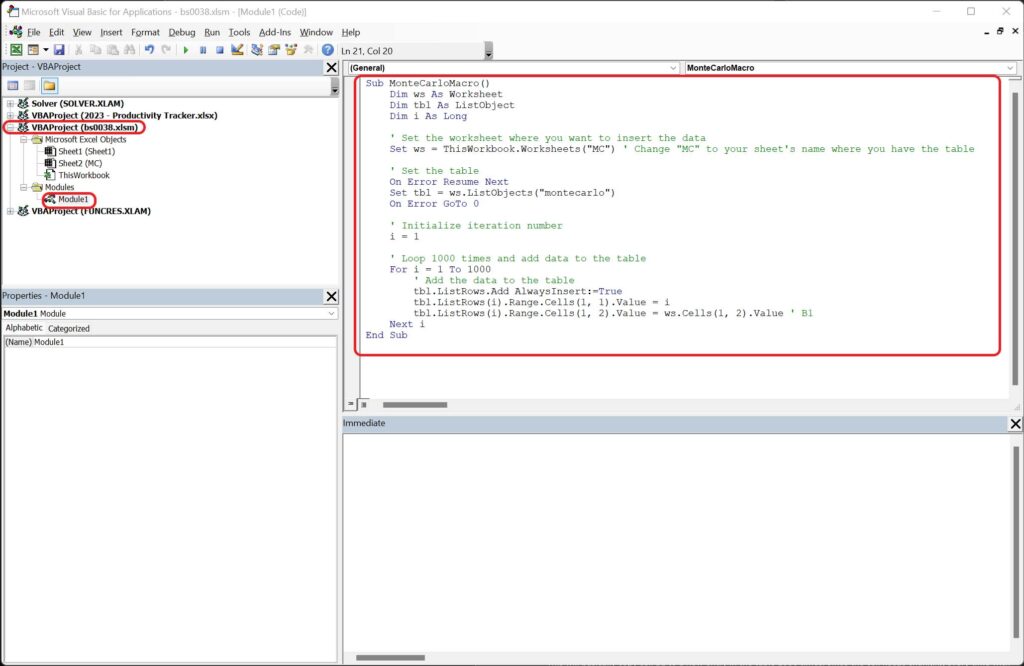
Now it gets tricky, because we have to run the actual Monte Carlo simulation. For this, we need to run a VBA macro. First, save your file in XLSM extension (and not XLSX) going to File > Save As. Then, be sure you have Developer tools enabled, go to File > Options > Customize Ribbon and be sure that Developer is flagged in the column on the right.
At this point, you can go to Developer menu in Excel (at the top), click Visual Basic, and you will see your VBA project. Insert a new Module by right clicking under your file name, then copy-paste the following code in it.
Sub MonteCarlo()
    Dim ws As Worksheet
    Dim i As Integer

    Set ws = ThisWorkbook.Sheets("MC")

    For i = 1 To 1000
        ws.Range("B1:D1").Copy

        Dim lastRow As Long
        lastRow = ws.Cells(ws.Rows.Count, "A").End(xlUp).Row

        ws.Cells(lastRow + 1, 1).Value = lastRow + 1
        ws.Cells(lastRow + 1, 2).PasteSpecial xlPasteValues
    Next i
End Sub
This will basically copy cell B1 to a new entry in the table 1000 times. Since the cell keeps changing every time with new random values, every new value we add will be unique.
Now, hit the play button (the green triangle) and wait for a few minutes, as it can take some time to perform 1000 runs. After you do that, your table will be filled with many different results. We can now get the 90% range in the center by looking at the 5% percentile (exclude the 5% lowest values) and 95% (excluding the top 5% highest values).
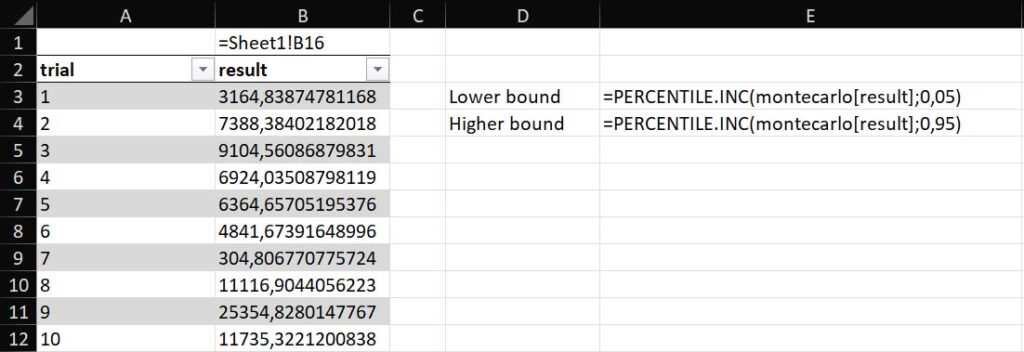
For your convenience, here I am pasting the formulas I have used.
=PERCENTILE.INC(montecarlo[result];0,05)=PERCENTILE.INC(montecarlo[result];0,95)I got a lower bound of negative $620 and an upper bound of $22k. Your results will be slightly different, but in the same ballpark. We can see that the potential benefit tends to be higher than the potential downside, however based on our circumstances a loss of $620 may be acceptable or not.
It is at this point that you have to decide if the level of uncertainty is good enough for you or not. Here we still have the possibility of loss, and the range of outcomes is quite large (23k in total). If this is not acceptable to you, you need to find way to reduce uncertainty, and this means collecting additional data. You want to collect additional data so that you can have a more precise mean and reduce standard deviation in your inputs.
For example, you could ask for a quote for the billboard and reduce uncertainty completely. You could ask for more information to the ads agency to understand really how many people will see the ad and how many are likely to call based on similar ads done in the past. Reducing uncertainty has a cost. Asking for quotes and information can have a negligible cost (but not zero, the effort you spend gathering information is still a cost), but some other activities can have higher cost.
If you plan to run the ad for an entire year, you may want to run it for one month and collect actual results and then decide if you want to buy the remaining 11 months. If you plan a nation-wide campaign, you may start to do it in a few cities to see how it goes, adjust your estimates, and then see if it is worth pursuing nationally.
The more the decision has economic consequences, the more you can invest in reducing uncertainty. In our example, since we have a potential loss of $620 dollars, investing up to $620 dollars to be sure our investment will be positive, and give us a return of 0 or more, it is going to be money well spent and justified. Investing more than $620 will not, because we would be better off just to try and risk losing $620 dollars at worst.
And this is how you do business decision-making. You estimate inputs, run a model with them to identify your range of estimates, and then spend to reduce uncertainty until your range of outcomes is narrow enough to tell you how to act (or clear enough, a profit between negative $2000 and negative $20k may just tell you there is no way of making money, so no point in narrowing your estimates).
In the next sections, we see in more detail how we can apply this to real cases of business decision-making.
Professional Business Decision-Making
Measure to Help Decisions
The first thing you need to remember when approaching business decision-making, is that measurement should help your decision process. There are two main fallacies when it comes to measurement: believing something cannot be measured, or measuring many useless things. Let’s address both concerns.
People often believe that some things cannot be measured. Think of things like “value of innovation”, “brand image”, or even the cost of a human life. It is true that some things are harder to measure than others, but everything can be measured. Some things can be measured with high accuracy (e.g., the exact number of trucks you have in your corporate fleet), others with less precision (e.g., our consultants spend 8 to 12 hours per week in meetings), and others with even less precision (e.g. developing this new technology will enable between $10m and $80m of revenue). But you can provide some measurements on even the most intangible thing.
My advice here is to start with a range to guide reasoning. Let’s pick the most challenging example, the cost of a human life. Even if you think this cannot be measured, you will know for sure it is worth much more than $1. I would expect most people to say it is even more than $100, $1000, or $1m. So, we know already we are in a range between $1m and infinity. But since infinity is not a number, we want an estimate at the high end of the spectrum. We can think of “how much would you pay to have a child if you wanted but could not biologically” or “how much society pays to cure and save people after injuries or tumors”.
This is not to say we need to find a number that would be equivalent to a human life. However, in certain circumstances, this reasoning works well. This is what government agencies in the US use to determine if a new regulation is worth implementing. Adding new safety measures in workplaces will cost X and save Y lives, is it worth it? If you start with this reasoning, you will be able to find an answer.
A side not on this: some people believe everything can be measured, but still think there are things that are unpractical to measure. This is true, but you don’t need high precision all the time. Even settling with a wide range is enough. You don’t need to know an exact age of a woman to know she is old enough to vote, and you don’t need to know the weight of a man to know it’s a little higher than it should be.
The other fallacy is measuring useless things. This is at the other end of the spectrum, and it typically happens in the frenzy once people start to realize they can actually measure everything. The fact that measuring everything is possible does not mean that you should measure everything. Measuring things is a cost, even if not economical, it is a cost in terms of time and resources spent. So, you need to do it wisely, measuring only what matters.
If you run a software company, you could potentially measure how many sheets of toilet paper your office consumes daily (or even hourly, or by the minute). You may find out that on the fourth floor they consume more toilet paper than on the second floor, and that Tuesdays are “quiet days” in terms of toilet paper consumption. This is not totally useless: it has some utility. You can better forecast how many toilet paper rolls you need to buy, and instruct your cleaning staff to service restrooms in the fourth floor more frequently than on the second. But is the cost of making this measurement worth the benefit it brings? Probably not.
So, when measuring, start with a decision in mind. What do you need to decide? Once you have this decision in mind, start to think about what are the items, parameters, and variables that influence your decision. Then, measure those, and those only.
For example, if you want to see if you should acquire another company, your decision should be influenced by how much that company is worth. Try to measure that. To be more precise, you can use decomposition (find smaller items to measure that create your bigger measure. For example, the value of the company to you is how much the company itself is worth, plus the synergies you can add after you acquire it). We will see the decomposition technique in further details later in our business decision-making journey.
Useless things can be subtle. In fact, you should focus on differential analysis. If you are evaluating a decision, as with “Is A better than B?”, focus on the difference between A and B. If something is identical between the two alternatives, it should not be part of the analysis in the first place.
Precision vs. Accuracy
Another key component in business decision-making is the concept of precision and accuracy. They are not the same thing, and since we are working with ranges it is important you keep the distinction in mind.
Accuracy is how well your range is centered; precision is how wide your range is.
For example, if you try to forecast the cost of buying a billboard, you know for a fact the billboard will have a specific cost. That is, one single number. However, you don’t know the number exactly, so you guess a range. The more the range is centered on the real number, the more you can say your measurement is accurate. That is, it reflects reality.
Precision is a different thing; it defines how narrow (and precise indeed) your measurement is. You achieve precision by narrowing your range: estimating a cost between $2400 and $2600 is more precise than between $2000 and $3000. Precision is not dependent on accuracy: you can be precise and be inaccurate at the same time (have a narrow range that does not really reflect reality).
Of course, you want to have high accuracy and precision all the time. But this is not often feasible. You should always strive for great accuracy, and then try to improve your precision. It is better to have a wide range that is accurate, than a narrow and precise range that is wrong.
In business decision-making, reducing uncertainty means increasing precision. Increasing precision often has a cost, as it requires additional measurement and analysis, so you need to evaluate if this cost is worth the benefit for every instance where you are thinking about running additional measurement.
How to quantify risk
Another important aspect of business decision-making is the quantification of risk. Since we are making forecasts and working on probabilities, there is a concrete chance that your estimate will turn out to be wrong. In fact, if we forecast with 90% confidence interval it will mean we will have 1 wrong estimate for every 10 estimates that we do. This is more than enough, as we will see when we cover asymmetric payoff functions, but we still need to account for this risk.
First, we need to start with a definition of risk.
Risk is the uncertainty of outcomes multiplied by their potential.
We know uncertainty: we may forecast $1m in profit, but we know this is 90% certain (or 10% uncertain). But uncertainty alone is not enough, we need to weigh it with the potential, the size and magnitude of the uncertain event if that happens. It may be tolerable to have a 10% chance of $100k losses, it may not be tolerable to have a 10% chance of going bankrupt (depending on your risk tolerance).
It’s easy to understand how you can quantify uncertainty: it is the probability of something happening. For example, you can easily say that a 90%-chance of happening is more likely than a 20%-chance. Quantifying potential, however, is the hardest part. This is because to compare risks, you need to assess them on the same scale.
You could confidently say there is a 60% chance of an earthquake of magnitude up to 4 happening within the next year in this area. Yet, what does this mean? You can compare this with other earthquakes (e.g. 85% of magnitude up to 2, 2% of magnitude up to 6 and so on). But if you need to compare with non-earthquakes phenomena, like terrorist attacks, price of oil increasing, and so on, how can you do that?
Comparison is crucial because it will tell you how risks rank with each other and will also tell you how each risk is impacting your project. You don’t typically measure your business results in magnitude of earthquakes, but in other financial parameters (say, revenue, profit, EBITDA etc.). How does earthquakes in this area can affect those dimensions?
The best approach is to convert potential to equivalent economic value. Think what the impact would be of a non-financial phenomenon happening, and what would be the economic consequences of that. As we saw earlier, various US-government agencies estimate the economic value of saving a life by introducing a new regulation, and then compare this value with the cost of the regulation the industry has to bear. Even if it doesn’t seem like that, this is business decision-making in practice.
Remember, when you quantify economic impact of a range you can always use a probabilistic range rather than an absolute value.
The cost of reducing uncertainty
Less uncertainty means narrower ranges, which means you are more confident. If you have well-grounded confidence, your business decision-making process will yield better results, and your business will be successful. This means we need to try to reduce uncertainty.
However, we do not want to reduce uncertainty as much as possible or reduce uncertainty for its own sake. We need to remember that reducing uncertainty has a cost, and we need to assess if that cost is worth. To do that, we consider the benefit of uncertainty reduction, and then compare this benefit with the cost. Let’s start with the benefit.
The benefit of reducing uncertainty is that you can make decisions with more confidence. Say you estimate with 90% confidence that the merger you want to do will have an impact on profits between negative $1m and positive $3m. If you can reduce uncertainty to say it’s actually going to be between 0 and $1m, you are going into the merger knowing you won’t bear the $1m loss for sure. If you were to go into the merger without having reduced the range, it means it was okay with you to accept that loss, if it was to happen.
As a result, in this specific scenario, reducing uncertainty is worth up to $1m. Rarely you need to spend so much money in business decision-making, but venture capitalists do (we have a chapter dedicated to that).
The cost of reducing uncertainty is the cost you must bear to do additional measurement and analysis. It will depend on what you are measuring. Remember that you can measure anything with a wide enough range, even starting with guesses. You can further improve your estimates by having guesses from an expert in the field (which has some cost, but it is typically cheap enough), or you can do some sort of field measurement. Typically, you would know in advance what is the cost of the activity that reduces uncertainty.
Once you have the full picture in place, you can decide if you want to reduce uncertainty, or you are fine with the one you already have. Remember, however, that the cost of reducing uncertainty is not only economical. This reduction has a cost in terms of time spent, and also in delays. A rough decision taken earlier can be more valuable than a more accurate decision taken later, so remember this in your business decision-making process.
Decomposition and aggregation
Two tools you should use in your business decision-making process are decomposition and aggregation. To yield the best results, you should use them together.
Decomposition is an intuitive concept. You have a big problem to solve, or big estimate to do, and you break it down in its components (you decompose it, effectively). Specifically for estimates, you then evaluate each component separately. For example, if you struggle to evaluate how much a plane would cost to build, you can think of estimating the cost of the fuselage, the engines, the gears, the navigation instruments, the furniture inside the plane, the cost went for quality tests, and so on.
Even with decomposition, estimate individual components with a range and confidence interval, rather than with an absolute value. After all, if you are no expert and you are unsure how much a plane costs, I doubt you will have more experience in evaluating what a plane engine costs.
Obviously, you can decompose into many levels, not just one. Getting back to the plane’s example, if you still struggle to estimate the cost of the engine, think what it would cost in terms of materials, assembly, shipment, and installation on the plane itself. You could further break down shipment in import taxes and freight cost if you wanted to, and so on.
The goal of decomposition is NOT to get as granular as possible. It simply is to get you granular enough to have components you can estimate with more confidence, or even with similar confidence as the “parent” component you are decomposing.
This is where aggregation comes into play. Once you have all your decomposed estimates, you can aggregate them back to estimate the parent item. For example, you can sum up the cost of engine, fuselage and so on (that you have estimated separately) to get the cost of the plane back. This is attractive because, even maintaining the same degree of accuracy, aggregating component estimates yield a more accurate estimate of the parent item, than if it was estimated as a single component.
For this to work, of course, you need to run a Monte Carlo model. You can generate 1000 combinations of the various component estimates using mean and standard distribution, and then use formulas to compute the value of the parent item. Collect all results, and then you can find out the mean result for your parent item and its standard distribution and use that in other models.
Differential analysis
Another concept worth exploring more in business decision-making is differential analysis. That means analyzing the differences between two (or more) alternatives. This may sound fancy at first, but it is really not. It also has nothing to do with differential equations, for those of you more into math.
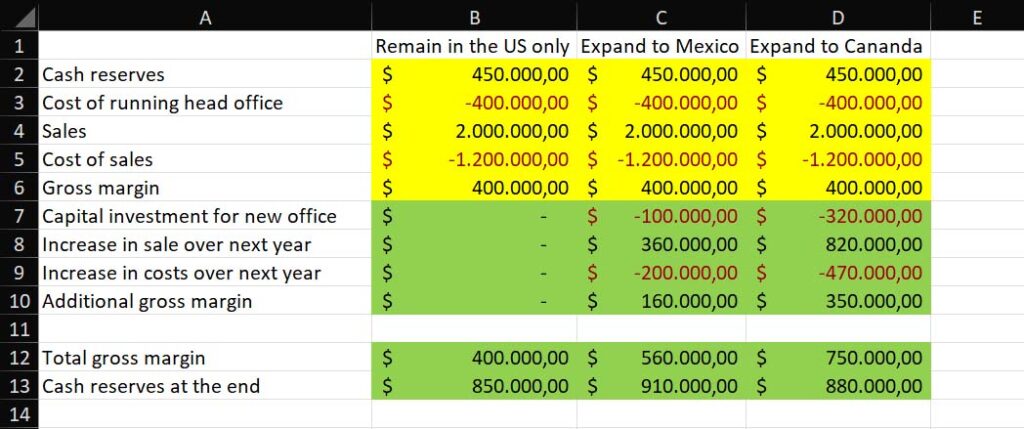
Differential analysis simply means listing all the parameters you have for your options, and then identifying which ones apply only to one or to another. We can take as an example a company that is considering expanding operation to either Mexico or Canada, or remain in the US (status quo). In this example, we market the non-differential parameters in yellow, and the differential parameters in green.
You have two options when it comes to differential analysis: full or partial.
With a full differential analysis, you consider all the parameters for all the options: both differential and non-differential parameters. In this way, you can estimate things like “total revenue” that depend also on non-differential parameters.
Alternatively, with a partial differential analysis, you look only at the parameters that are different, excluding the non-differential ones. This is the quickest approach, but it has some caveats. Often, it’s not easy to discern what is differential and what isn’t. You cannot really say if this additional cost that option A has is something you would incur even without option A. That is not to say it is impossible to discern completely, but it takes skill and ideally some accounting background. If the moving parts aren’t so many, go with a full differential analysis instead.
The most important takeaway from this business decision-making tip on differential analysis is: do either full or partial. You don’t want to consider a non-differential parameter for option A, but omit it when evaluating option B. Be consistent, otherwise your analysis would be worthless.
Run a Monte Carlo Simulation
The key in business decision making is to run the Monte Carlo simulation, or model, so that you can account for all possible scenarios. If you omit this step, your business decision-making will be based totally on guesses.
Monte Carlo simulation warrants its own article, and this is why we have the ultimate guide on it (click here). If you are not familiar with Monte Carlo, read that guide, it will help you to structure your model in a way that aids your business decision-making. If you are familiar, you can read here the tips.
To run a successful Monte Carlo model, you start by defining the model as a set of formulas that make calculations on some parameters. This is the very first step. Then, you estimate those parameters with a standard distribution, using (supply your own mean and standard deviation):
=NORM.INV(RAND();mean;standard deviation)Create a table to collect all results, and then run the following VBA macro to store various runs of the model in the table. This table assumes you have a two-column table named “montecarlo” in a sheet named “MC”, and the result of your model is displayed in cell B1 of the MC sheet.
Sub MonteCarlo()
    Dim ws As Worksheet
    Dim i As Integer

    Set ws = ThisWorkbook.Sheets("MC")

    For i = 1 To 1000
        ws.Range("B1:D1").Copy

        Dim lastRow As Long
        lastRow = ws.Cells(ws.Rows.Count, "A").End(xlUp).Row

        ws.Cells(lastRow + 1, 1).Value = lastRow + 1
        ws.Cells(lastRow + 1, 2).PasteSpecial xlPasteValues
    Next i
End Sub
Once you have this in place, you can compute mean, standard deviation, and percentiles on the computed table. We saw all this already, but what are the tips to make a Monte Carlo analysis better for business decision-making?
- Run the model between 1k and 10k times
- Use decomposition to estimate complex parameters, run a separate model for each decomposed component and then compute mean and standard deviation on that model to create the estimates in the main model. For example, use a separate model that estimates the costs of plane components to find that the mean cost of a plan is $60m with a deviation of $20m, then use these two numbers in the main model.
- Use percentiles to estimate the 90% confidence interval (range between 5% percentile and 95% percentile)
- Use sensitivity analysis (see next section)
Sensitivity analysis
Sensitivity analysis is another powerful too in business decision-making. If you have a model with some initial parameters, sensitivity analysis enables you to understand how sensitive you are to each parameter. For example, if you have a model that computes revenue and includes the cost of electricity, how much a 1% increase in electricity impacts revenue?
Intuitively, you know that heavy industries that use a lot of energy (e.g., steel, factories etc.) will be much more sensitive to this increase in cost than a service company that only runs an office. But how sensitive?
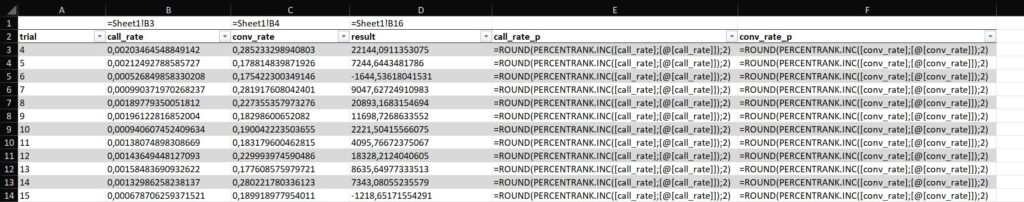
You can find all the answers you need in your Monte Carlo model. If you want to run this analysis, run the model at least 10k times, as we have a two-dimensional estimate. Then, instead of collecting only the final output in the montecarlo table, also collect the input parameter (or parameters) on which you want to do sensitivity analysis. In our example, we will have a three-column table: trial, cost of electricity, and revenue.
Then, use a formula to rank based on percentile. Since we want to look only at integer percentiles (e.g., 5th percentile and not 5.23th percentile) we can also use round and round to two digits. If we get back to the previous example of buying an ad, we can use sensitivity analysis on call rate and conversion rate:
=ROUND(PERCENTRANK.INC([call_rate];[@[call_rate]]);2)=ROUND(PERCENTRANK.INC([conv_rate];[@[conv_rate]]);2)If we show formulas, it will look like this:
Now, we need to create a separate table to track “what happens if call rate or conversion rate increase of 1 percentile point?”. We will do that in two separate tables, one for call rate and the other for conversion rate. Simply put, we list all percentiles (all numbers from 0 to 1, in increments of 0.01), then use a formula to compute the mean of result from that percentile, and see how much of an increase it is. This is what formulas will look like:
The mean for result at each percentile point:
=AVERAGEIFS(montecarlo[result];montecarlo[call_rate_p];H4)The increment of percentile (will always yield 0.01 in our case):
=(H5-H4)/$H$104The increment in the result variable over the maximum result variable. That is, the increment in percentage points of the result variable, associated with a 1% increase in percentile on call rate.
=(I5-I4)/$I$104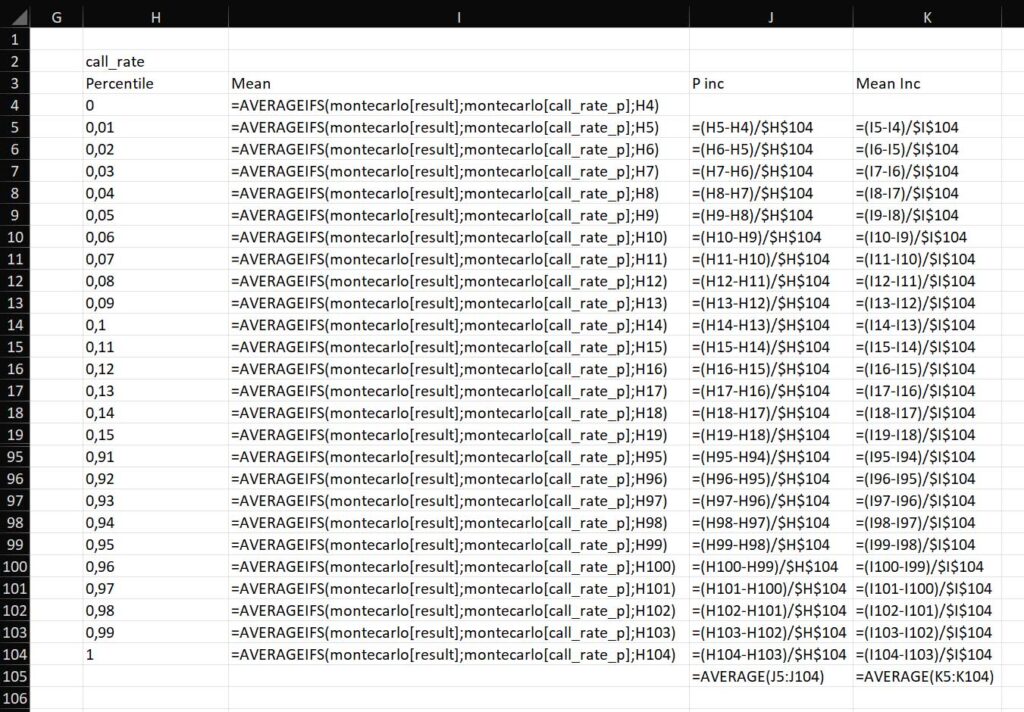
If we repeat the same process for conversion rate and show the actual values rather than formula, we will see something like this:
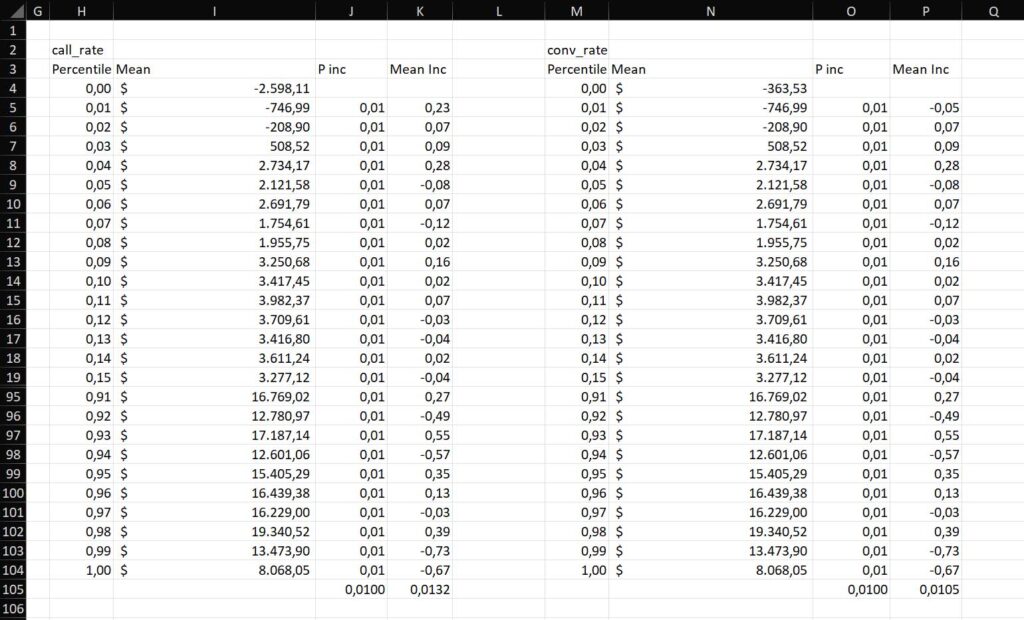
We can see that both relationships are linear, a 1% increase in conversion rate yields to a 1% increase in revenue roughly. We are more sensitive to changes in call rate (0.0132) rather than in conversion rate (0.0105), so if we need to focus our effort to reduce uncertainty of a variable, call rate would take precedence.
Communicating decisions
Business decision-making is not exclusively about making the best decisions. It is about ensuring you can implement them correctly. There is no point in setting up a factory in a new country if then you can’t run it, inventory disappears, and you lose money.
Of course, actual implementation of decisions depends on the decision itself, and it is not part of the decision-making process, nor covered in this guide. Yet, communicating decisions is. This communication is the first step that glues the act of making a decision with the act of implementing it.
Communicating a decision is easy: we are going to build a new plant in city X, we will exit the low-end of the market, we will have to fire 1000 people, we will move headquarters, we will acquire this other company, and so forth. What has been decided is clear, and easy to communicate. The struggle is to communicate why.
If your business decision-making is sound, it means you are taking the best possible decision based on the information you have available. Anyone in your shoes and with access to the same data should come to the same conclusion, provided that it values items in the same way as you do (e.g. prioritize delivery speed over return rate of orders).
So, whenever you communicate a decision, convey:
- The actual decision that has been made
- The data and information used to make the decision. Depending on how confidential the decision is, and who you are talking to, consider sharing the whole decision-making process, including the Excel you used for Monte Carlo analysis
- The priorities or strategic choices: how much value you decide to give to some parameters and why
If you share all this information, people have an easier time understanding your decision and committing it. Otherwise, especially with unpopular choices, people may question the value of the decision itself and then not deliver on the implementation.
Advanced Business Decision Making
In this section, we see some advanced business-decision making techniques, ideas, and tips applied to real-world scenarios.
When you don’t know what to decide about
In business decision-making, it is not uncommon to have ambiguity around what decisions you should be taking. This is even more evident if you are heading a business, you don’t have anyone to guide you and you could potentially do anything, so this is why you don’t know what to do exactly.
Do you focus on increasing revenues? Containing costs? Nurturing brand image? Acquiring an high-visibility customer even if at a loss? Enter a new market? Develop a new product? Resources are limited, options are not, so what do you do?
When you don’t know what to decide about, my advice is to start to list a rough Monte Carlo analysis with various options and provide a ridiculously wide range of estimates for each. Run the model, identify what looks more promising, and then go refine a specific model for those parameters. Then repeat, until you find an option is ruled out or that is promising indeed.
Batching techniques in decision making
Another component you should consider is when and how you make business decisions. Timing and size of decisions is a key part of business decision-making, so you should consider it as part of your framework.
In general, small decisions have a limited impact, they rely on limited parameters, and thus are easier to make and faster to implement. You should strive to make as many small decisions as possible instead of infrequent large decisions with huge impact. If you screw on a large decision, especially if your business is new and cash-strapped, you risk getting out of the game soon.
This is where batching is helpful. Batching is how you group units in transactions: how do you group multiple boxes together in a single shipment, how do you group production orders together in a single execution in the plant, and how do you group decisions together in a single decision session. Large batch size means you process many units (boxes, orders, decisions, etc.) at the same time. This means you can do less transactions (review decisions less often), but when you do it will require more effort.
The advice here is to keep the batch size small and do that with a cadence. Set yourself a schedule to decisions, for example allocate two hours every Tuesday. The actual schedule (monthly, weekly, daily etc.) is up to you, your company needs, and the kind of decision. However, do have a schedule, and then defer any decision in that point in time where you have planned decision-making.
This enables better coordination for decisions across the entire company, provided all units start to batch decisions in the same way and at the same time. Whenever the “decision review” time happens, process any decision you must make. This ensures that no decision gets deferred too long or becomes too big.
The key here is to decide on things you don’t do as well. If you have a decision on “where should we buy the Mexican office”, do that and find the city/area, then if you don’t go to Mexico at all that’s okay.
Asymmetric payoff functions
Another important concept in business decision-making is the asymmetrical payoff. For most things, especially in developing new products, there is the possibility of having negative or positive impact. However, the negative impact is limited, while the upside can be huge.
For example, creating a new product may result in $500k loss, or up to $10m in profit. You can see that the profit side of things is much bigger. Thus, it is worth making many bets of this type, but no one that alone can wipe your savings and make you go bankrupt.
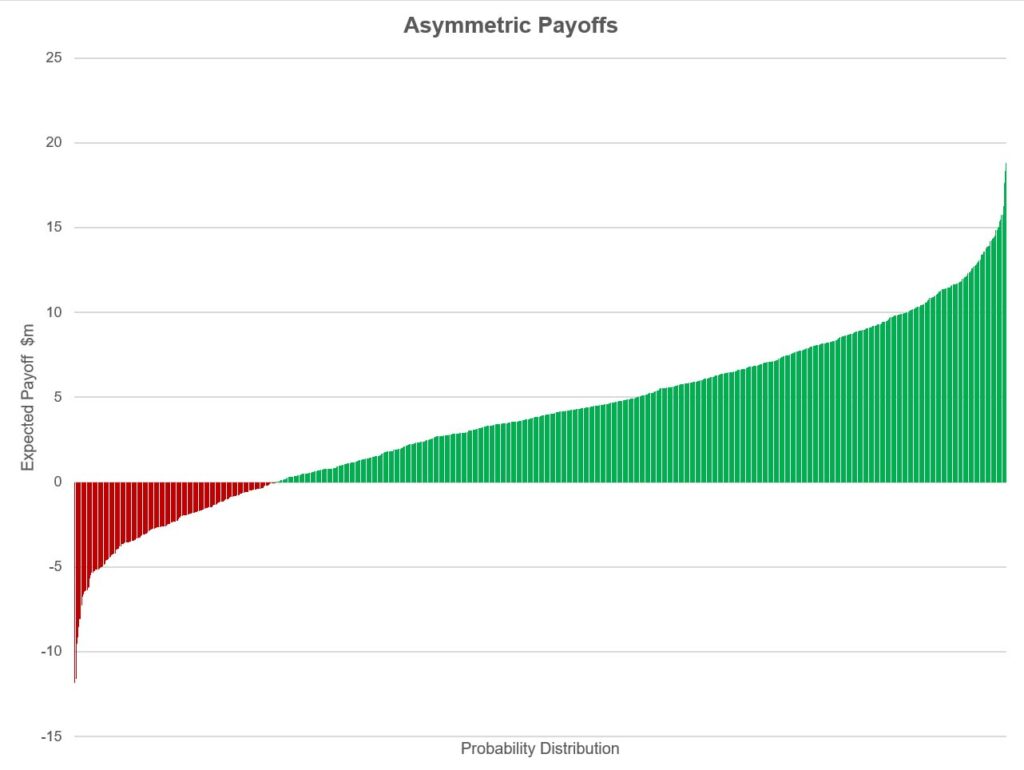
As you can see from the graph, the green side of the chart (with positive returns) is wider and has a much bigger area than the red side. And this graph was built with a simple standard distribution, typical product development will have a green area that is even wider and bigger in size than red area.
All this is to say you can afford some risk. You can invest a little bit in a project, see if it is promising, and then double down on it or kill it.
Venture Capital
Venture capital has gained popularity in recent years as a way to fund startups. As we are about to see, it is nothing more than business decision-making and uncertainty reduction.
A startup is a new company with a promising idea but with little or no money. In other words, it is an entity that incurs net costs only (and no net profit), and it does that with the purpose to turn an idea into a reality. If the startup is successful, the idea becomes a reality and it is adopted by the market, then they will start to make money, even a lot of money potentially.
Venture Capitalists are investment funds that look for startups, analyze ideas, and inject cash into the startups they like, with the idea they will turn profitable. Most startups fail, but VCs are okay with that because the ones who succeed will bring huge payoffs. The payoff function is asymmetric: for each startup that fails, the VC “wasted” little money, but the one or two that succeed can generously cover for all the losses and then some.
When a VC invests in a startup, all it is doing is reduce uncertainty. They look an idea that is promising, they estimate something like “We are 90% confidence this startup can make between negative $0 and $80m”, and then they consider worth investing $100k to let the startup run a few more months. In a few months, the product will be slightly more mature, and the chances of success will be clearer. At that point, they may say “Now we are 90% confident they can make between $20 and $36m” and pour 1 more million in it to develop the product.
Decisions and decentralized authority
One final aspect of advanced business decision-making is who makes decisions. Decisions can be centralized (the head of the company decides everything) or decentralized (people in the field decide everything). Most likely, it is going to be something between the two, and it will vary from company to company.
The more you push decisions to the frontline, the quicker you can make decisions. People often assume this is a tradeoff with the quality of decisions and with the ability to coordinate with other teams, but it does not have to be. Sound business decision-making focuses on defining a framework that can ensure everyone decides in the best interests of the company.
As a business decision-maker, you should focus on defining the rules for decisions. Then, let people in the frontline look at those rules and implement decisions accordingly.
For example, when designing a new plane there are two important components: the cost of the plane, and the weight of the plane. An increase in weight must be offset by a decrease in cost, and vice versa. There are many people and teams building a plane, how can you be sure the increased weight in the engines is offset in the decreased cost of instrumentation, if they are managed by two completely different teams?
If you set a rule that “each increase of 1kg must reduce cost by $3000”, then the instrumentation team that is light on weight can sell its “weight credits” to the engine team and use the money for instruments. The engine team, instead, can now have a heavier engine but needs to meet a lower cost specification. While all this happens, no central program manager must be involved. Decisions are quick.
If you set up something like this, and you should, you can use a Monte Carlo model to define the proper number of “weight-to-cost” conversion, or whatever parameter is relevant for your business.
Conclusion
Additional resources
Business decision making is a huge topic, and this guide should give you everything you need to start and be independent around decisions. But you should dive deeper, here are some resources that can help you:
- The ultimate guide to Monte Carlo analysis in Excel
- Complete guide to Python in Excel
- Hubbard – How to Measure Anything
- Reinersten – The Principles of Product Development Flow
Connect and get help
I always want to close our guides with a personal note. This aims to be the ultimate guide for business decision-making you could ever find online. If there is something missing, something not clear, or a whole new topic you want to add, please reach out to me on LinkedIn, and let’s chat.
Please, mention in your invitation that you found me through this blog. I will accept everyone, provided you provide a note explaining you found me here.