Knowing how you use your network is an important asset. However, this easier said than done, as you will need to assess several components of the network. While this is a complex task, having a clear picture of bandwidth usage is simple. Today, we see how to use bmon to project real-time charts of your network usage in Linux. This is similar to what you see in the task manager on Windows, just more powerful.
What is bmon?
Bmon is a free tool that allows you to plot your network statistics on-screen. It works in the terminal and creates nice charts of your bandwidth, real-time. Thus, it is a great tool when it comes to troubleshooting network problems. Besides merely learning how to use it, we will also see some common use cases.
Getting bmon
Use your package manager to get bmon, it is just a single package. For example, on Ubuntu we used sudo apt-get install bmon. You can also use yum on the Red Hat family, or dnf on Fedora 22+. This will install bmon, and now you can simply run it by typing bmon. However, before we do that, it is better to generate some traffic to grow our bandwidth usage.
How to use bmon
Create some traffic
This step is optional but recommended. You don’t want to see a flat chart, right? Thus, we first need to generate some network traffic. You can go the easy route, watching a video on YouTube, or downloading something. However, this is not always possible, not to mention it isn’t professional. Instead, you can opt for a bandwidth test software like iperf. This tool allows you to generate traffic according to your specifications, and you can install it as quick as sudo apt-get install iperf3.
Then, you can run iperf3 -s on a terminal, and iperf3 -c localhost -t 100 on another terminal to test connection to the loopback interface for 100 seconds. This is probably the shortest explanation of iperf you could find, but if you want to learn more we got you covered. Just check our iperf3 tutorial.
Reading bmon charts
Once you have some traffic going, open a terminal (yet another if you were using iperf3) and type bmon. You will see something like this:
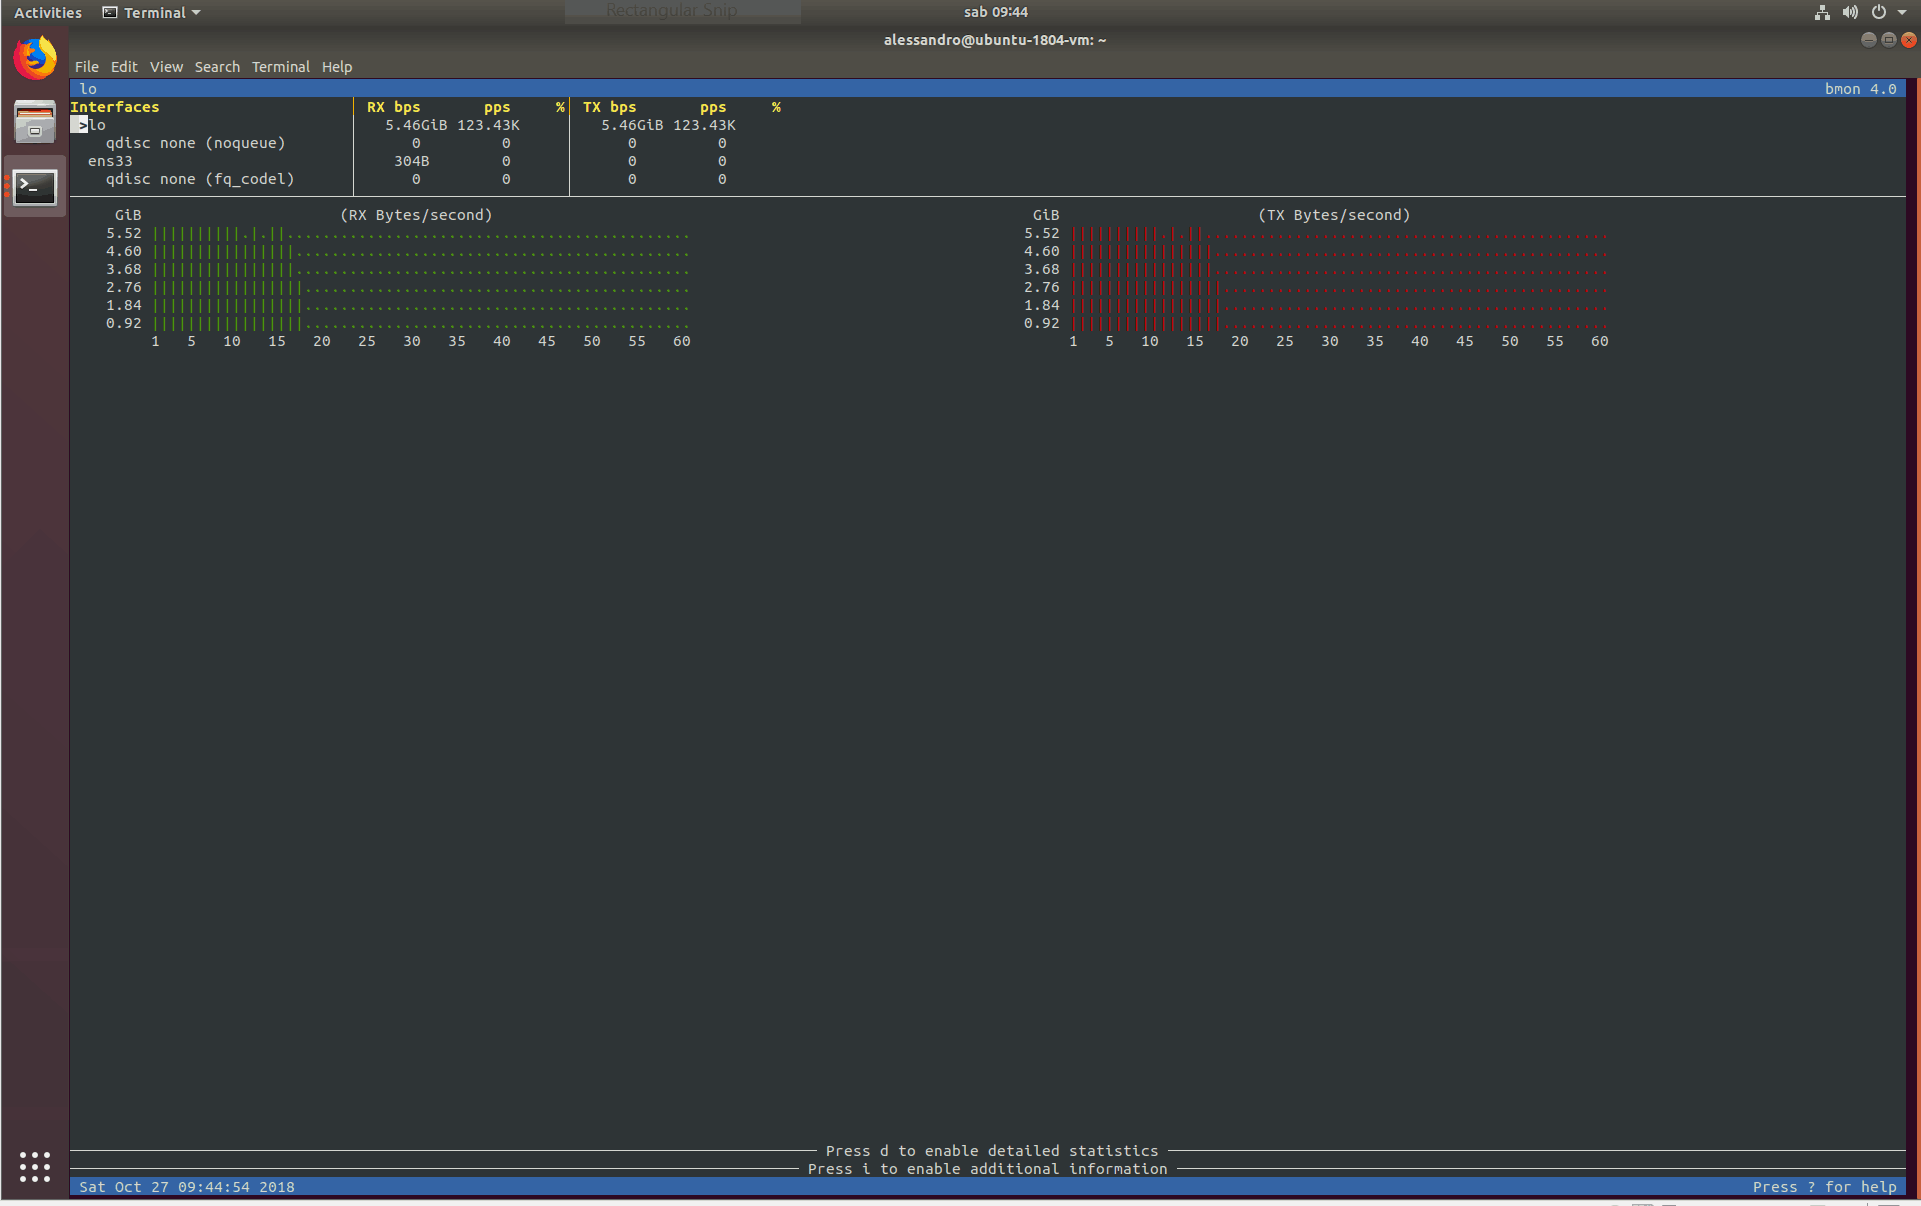
As you can see, we have a main area in the center showing two charts: the bandwidth received (RX, in green), and the bandwidth transmitted (TX, in red). Just above that, we have three boxes:
- In the interfaces box, you can select which network interface to see the charts for. You can scroll using up and down arrows. In this example, we are watching charts for the loopback interface (
lo). - The next box gives you information about the received traffic (RX). You see the received traffic for all interfaces in bits per second and packets per second.
- Finally, the rightmost box shows the same information about the RX box, but for transmitted traffic (TX).
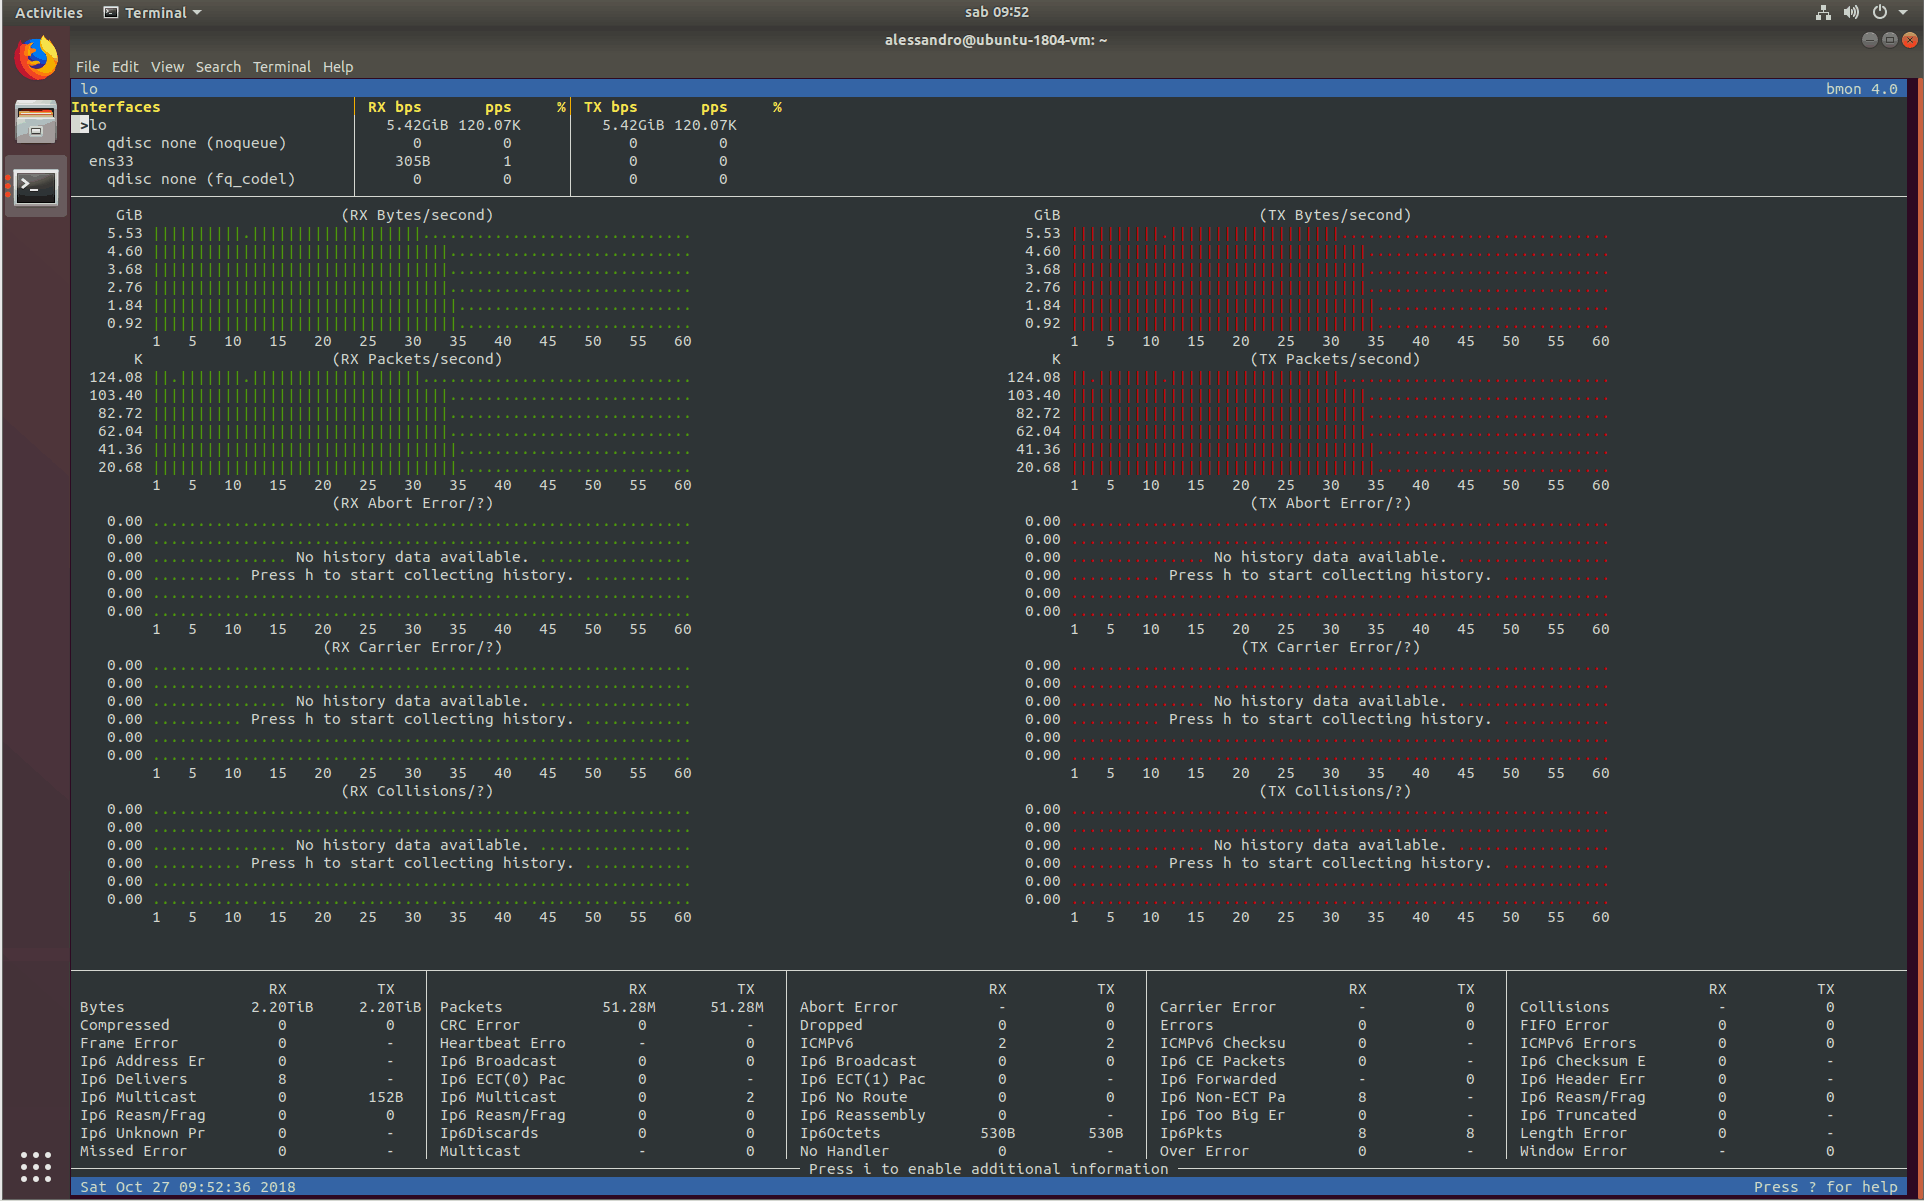
You can also see additional information by pressing d, or add more charts with <. You can remove the charts you added with >. Additional charts will show information about errors, collisions, and other network problems. Since we are testing a loopback, we don’t expect any.
Once you are done, you can quit by pressing q.
Summary
Bmon is a powerful tool in the Linux prompt to monitor bandwidth usage and errors. Install the bmon package with your package manager, then simply run bmon. Use d, < and > to show or hide information and charts, up and down arrow to select the interface to see charts for. To quit, just hit q.
With bmon in your toolkit, you are ready to do the nasty troubleshooting sometimes required to network engineers. Try it and let me know what do you think about this simple, yet awesome, software.